My first real adventure into the embedded world has been porting the TSIC temperature sensor code from arduino to Rust. While the code seems to work fine for my use case, there are some pieces in the code which I ported from C but always scratched my head about. I neither owned a Oscilloscope nor a Logic Analyzer, so I was flying blind and had to trust the code I was porting.
I finally got around buying a Logic Analyzer: the Saleae Logic 8, which the company sells at a good discount to enthusiasts which do not do any revenue generating work with it.
With this shiny new toy in my hand, it’s time to revisit the sensor and see what it’s actually doing on the wire.
Setup
Connect the Logic 8 to the computer via USB and then open the Saleae UI. Note that they provide a new (but still unstable/alpha) version of the software, which is the one I’m using right now (2.3.15 to be precise).
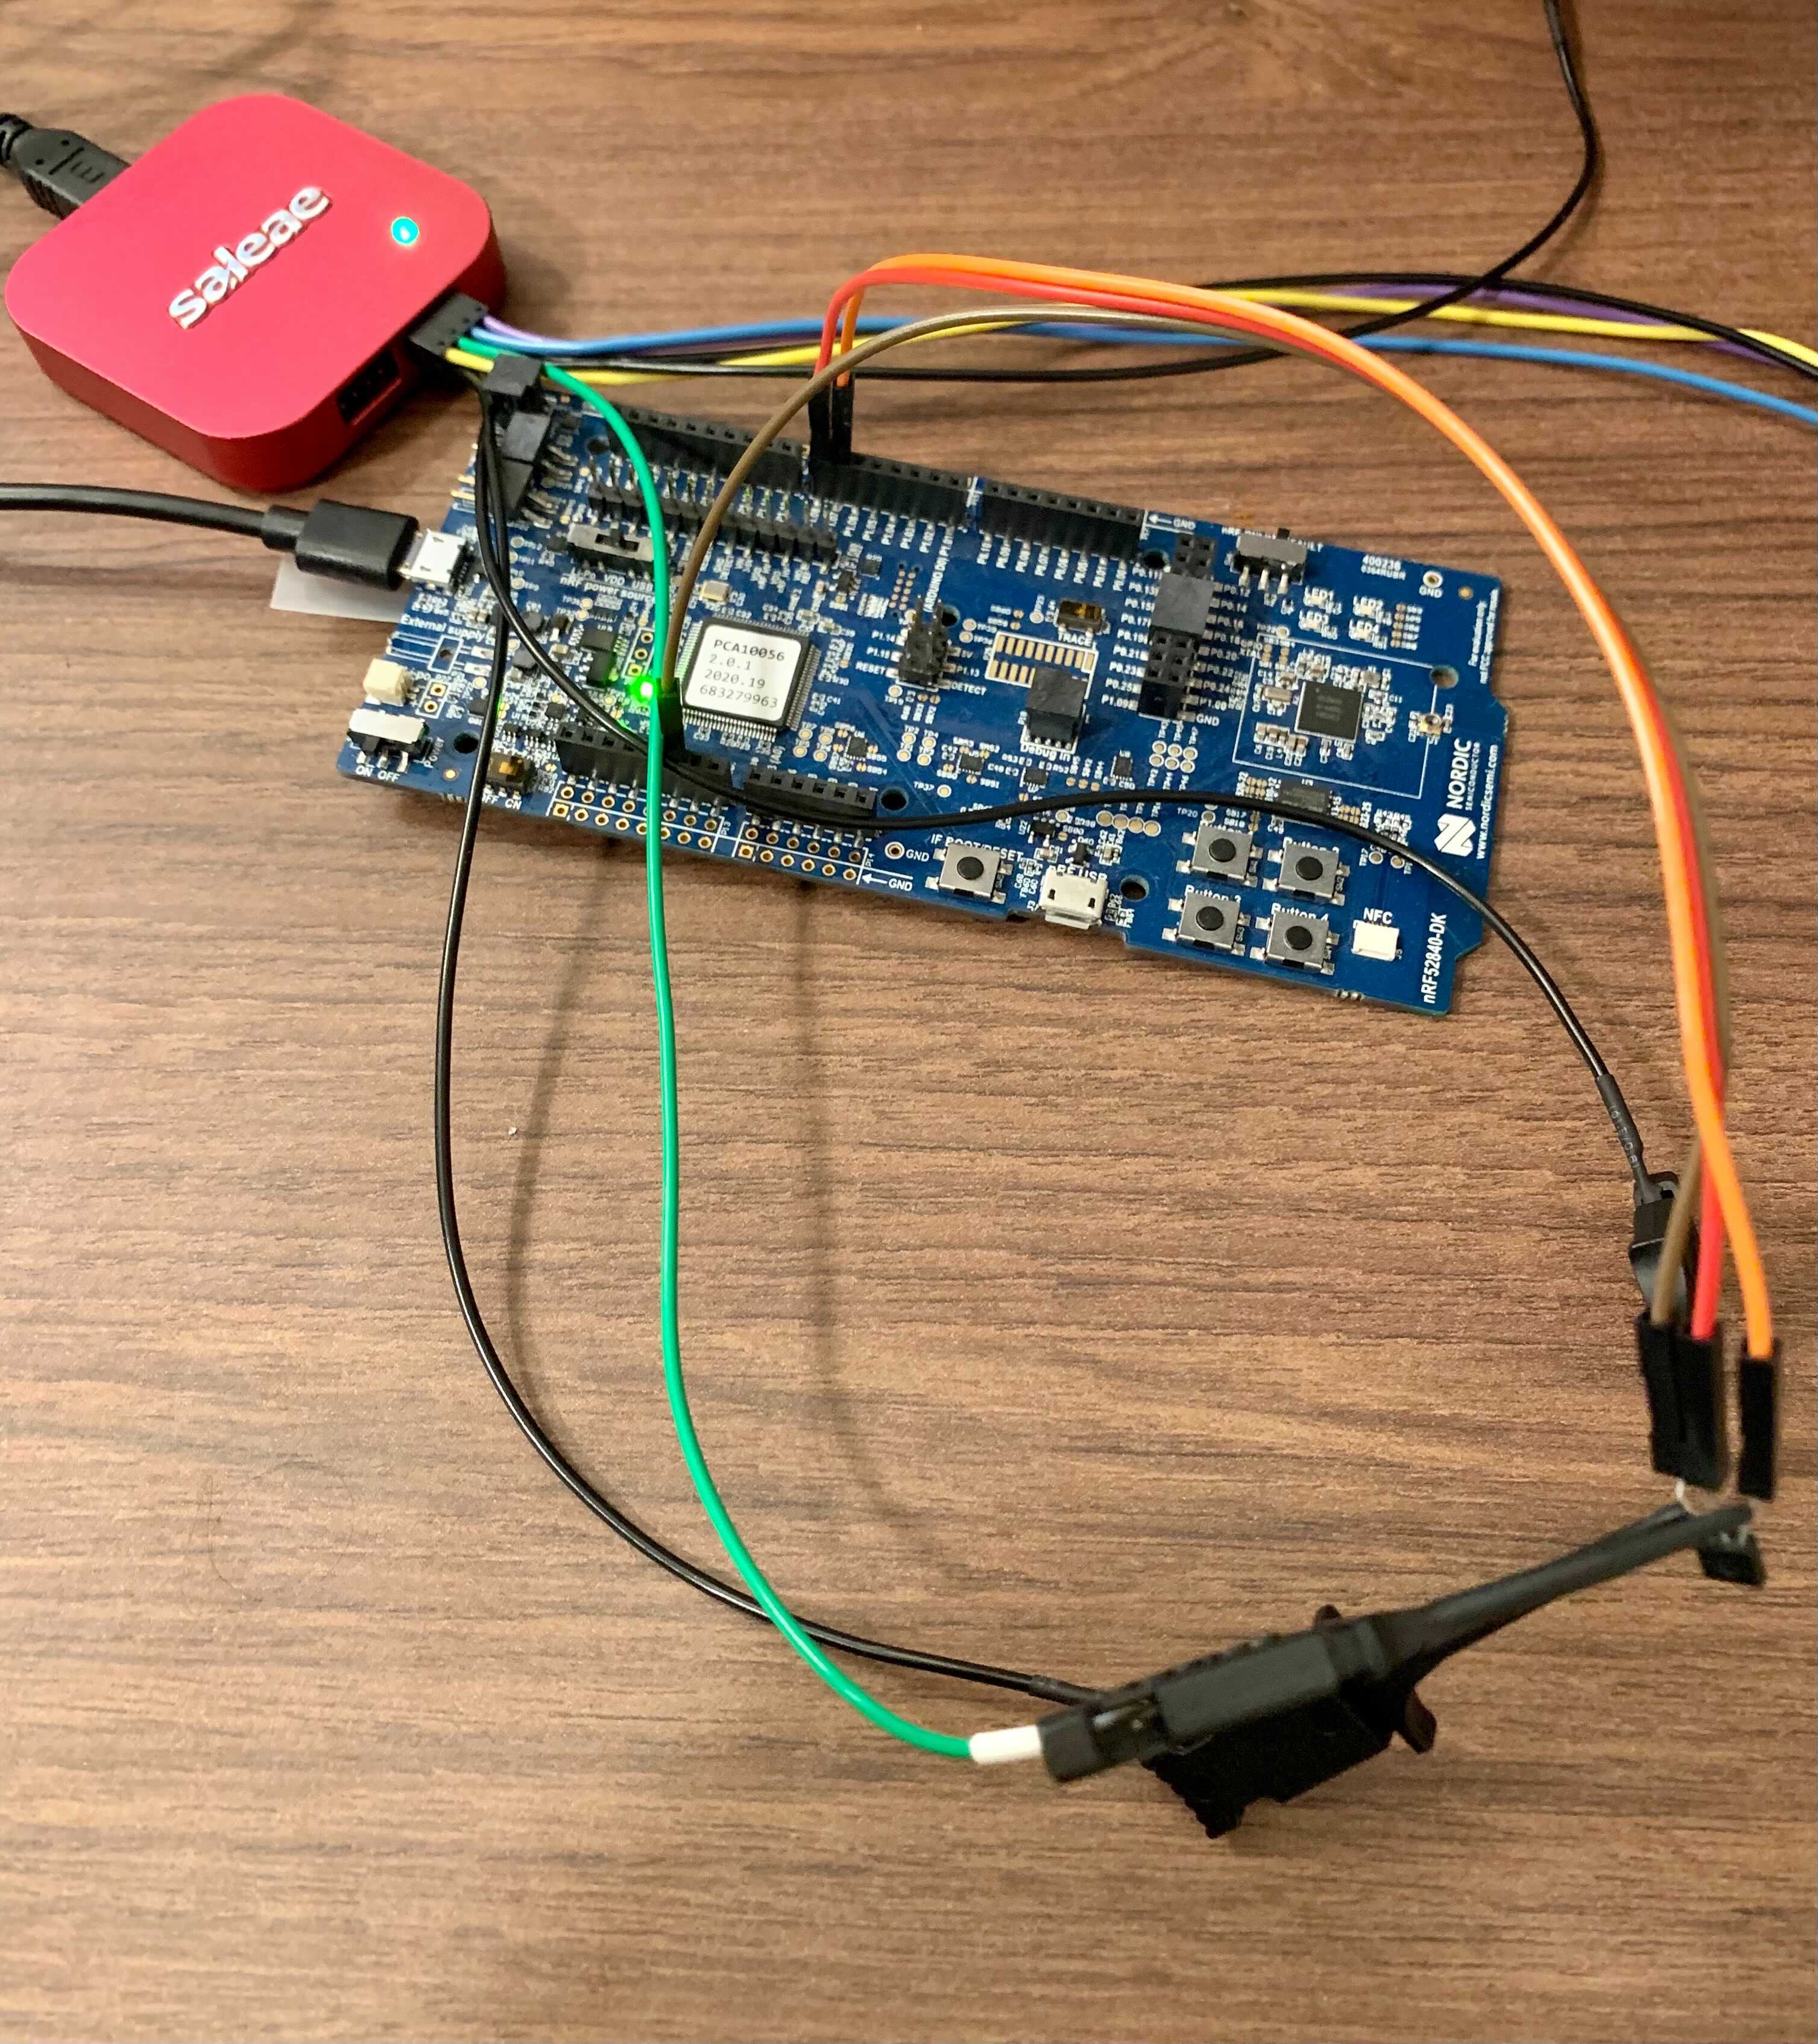
The TSIC 306 sensor has three pins: a VDD pin, a signal pin and the ground pin. Make sure to not forget to also attach the ground pins, otherwise it won’t work properly (ahem, not that I did that…).
Here is a picture of the full setup:

I’m using the nRF52840 DK, about which you can read more about in this blog post.
The code uses my tsic-rs crate and performs a read every second:
|
|
The signal pin is attached to port 1.08 and the VDD pin to 1.07. We need to provide the VDD pin as well because we let the tsic driver control the power. It will turn on the power, then perform a temperature reading and then power it off again.
Protocol Analysis
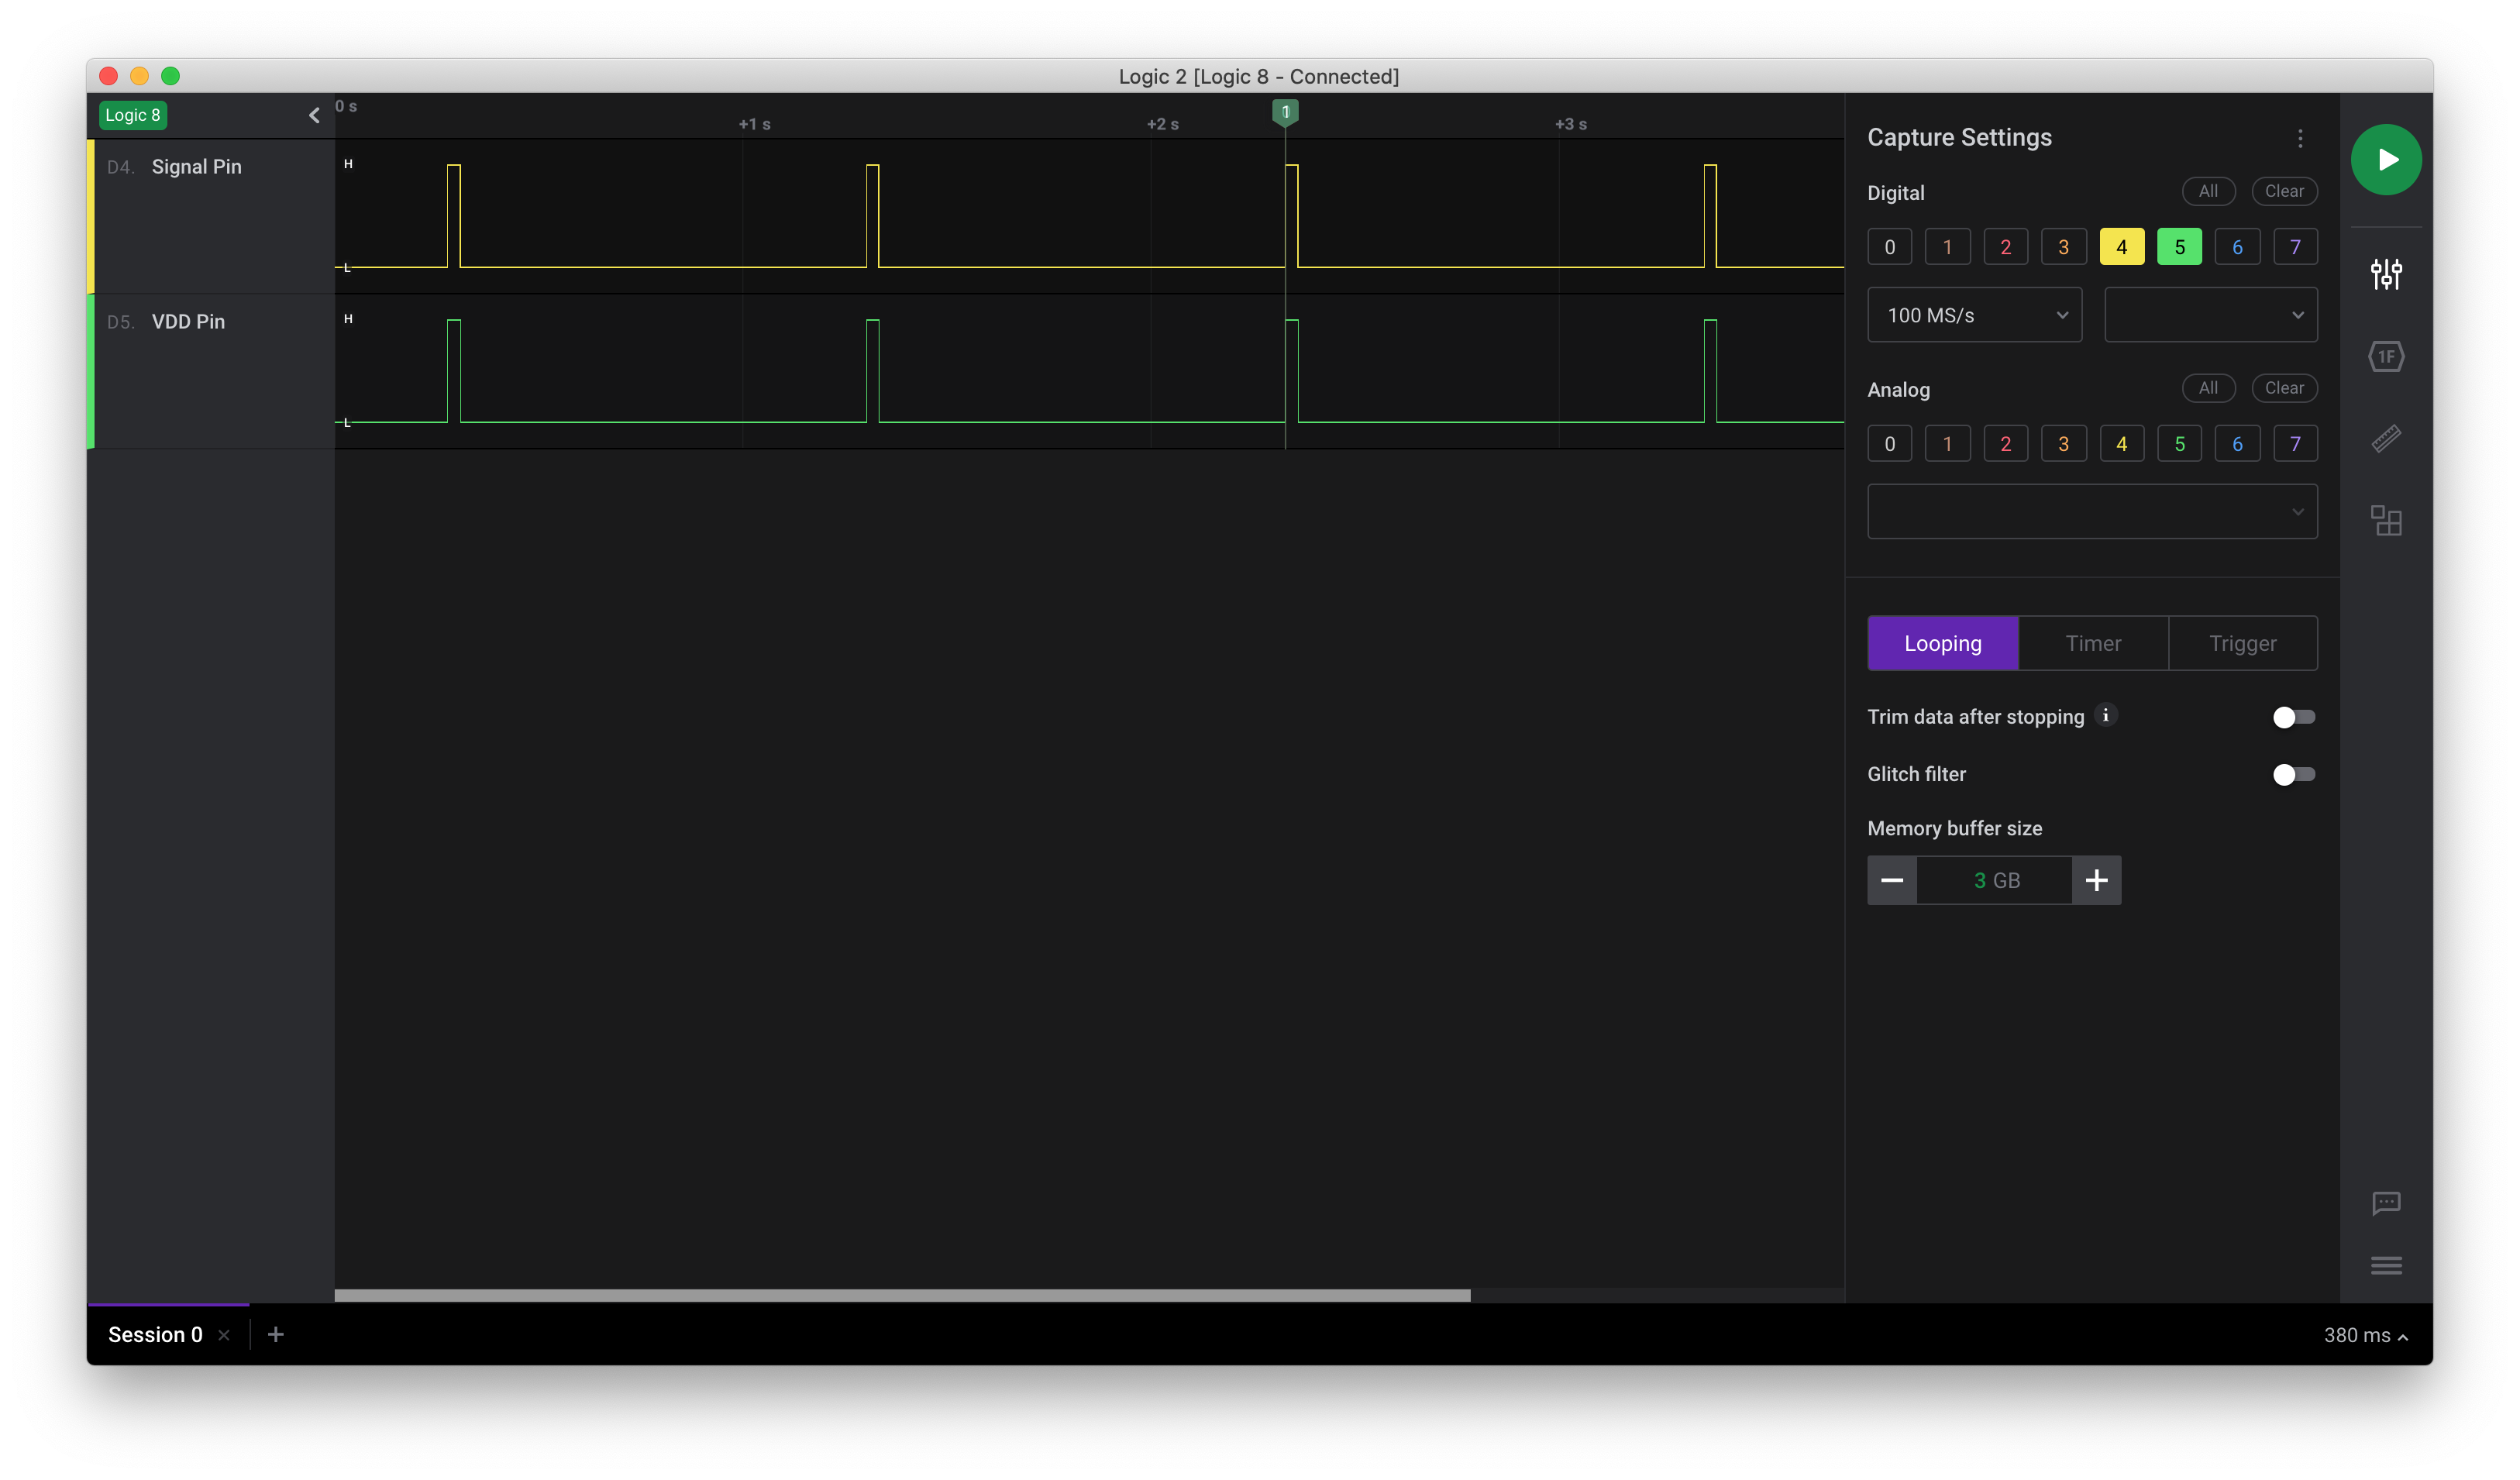
Flashing the program, we’ll see a temperature being printed every second. We can now start a recording with the logic analyzer and let it run for some time:

Two things immediately caught my eye: first, it seemed to have worked! Second, there is (as expected) a correlation between the VDD pin being high (so the sensor is powered on) and the signal ping sending data.
Let’s zoom in to an individual sequence:

When the sensor is powered up, it takes around 30ms until it actually sends the temperature information. The application notes from the sensor say:
TSic will transmit its first temperature reading approximately 65-85 ms (This value is depending on the temperature. In lower temperatures this value can be lower too).
That’s quite a difference, but the code is waiting for the first falling edge anyways. Now let’s zoom in a bit more to the time where VDD goes from low to high:

It takes 260ns until the signal port goes to high from when we powered it up. Why is this interesting? Well one of the things I saw when porting the code was that an initial delay is specified before we wait on the falling edge (https://github.com/daschl/tsic-rs/blob/master/src/lib.rs#L60). That delay is set to 60 microseconds, so it looks like we can tune this down even. But since we don’t get a proper reading many milliseconds later, the value should be alright.
Now that we have a good overview of what is happening each power cycle, let’s dive a bit deeper into the ZACWire protocol. The following screenshot shows the period where the sensor actually sends data (after the 30ms idle time):

Going back to the application notes:
When the falling edge of the start bit occurs, measure the time until the rising edge of the start bit. This time (Tstrobe) is the strobe time. When the next falling edge occurs, wait for a time period equal to Tstrobe, and then sample the ZACwire signal.
In our case, the strobe length is 52 microseconds.
Originally I had the sensor permanently powered on and read every second, but that led to mis-readings since the could would catch a reading not at the beginning of the transmission but somewhere in between.
Back to the application notes once more:
The update rate of the TSic can be programmed to one of 4 different settings: 250 Hz, 10 Hz, 1 Hz, and 0.1 Hz. This is done during calibration of the sensor on IST AG side. The standard update rate is 10 Hz (TSic 206, TSic 306, TSic 506) or 1 Hz (TSic 716).
So if this is true, we should see a reading every 100 milliseconds if the sensor is continuously powered on. We need to make some code-changes:
|
|
By calling without_vdd_control instead of with_vdd_control we manually control the VDD pin and set it to high. The logic output looks quite different now:

Zooming in further it looks like the 100ms are actually closer to 80ms (so around 12Hz), at least with my sensor at room temperature:

What’s next?
There are a couple more things I’d like to drill into, for example I’ve read somewhere that the intervals and strobe time changes as the temperature changes. Since my sensor is attached to a boiler, I’d like to do longer simulations from room temperature up to 100°C and see if and how it changes.
Also, I wasn’t able to set a marker each strobe time to easily extract the high and low values to manually decode the value. I think a custom analyzer would be very good for this task, so I’m planning to experiment with that in a later post!
If you have tips or questions to share, please do so in the comments below.